How to use the "NHK News / Disaster Prevention App" -How to check disaster information on a map
Map and location information
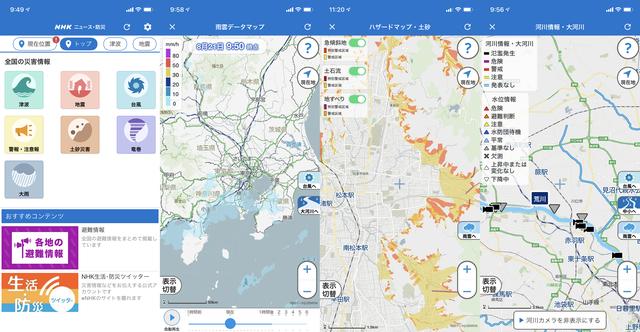
An example of the disaster information display screen of the "NHK News / Disaster Prevention App". (From left) "Disaster information" top screen, "Rain cloud data map" screen, "Hazard map" screen, "River information" screen[table of contents]
- What is "NHK News / Disaster Prevention App"?
- First, let's display the "rain cloud data map"
- To display "Hazard Map" or "Sediment Disaster Risk Map"
- To display "live camera" images and "water level information" of rivers
- To set the "push notification" function
- To check all the disaster information of "current position"
* Click here to download the "NHK News / Disaster Prevention App"
What is "NHK News / Disaster Prevention App"?
As the name suggests, the "NHK News / Disaster Prevention App" is an app that provides various information for disaster prevention in addition to NHK news articles and video content. It is a tool that allows you to grasp the latest disaster-related trends, and it can be said that it is one of the standard apps that you want to install on your smartphone in these days when natural disasters such as heavy rains and typhoons occur frequently.
As disaster information, it covers information such as tsunamis, earthquakes, typhoons, warnings and warnings, and it is also a feature that various information can be displayed and confirmed on a map. This time, let's explain how to use the "NHK News / Disaster Prevention App" focusing on this map function.
First, let's display the "rain cloud data map"
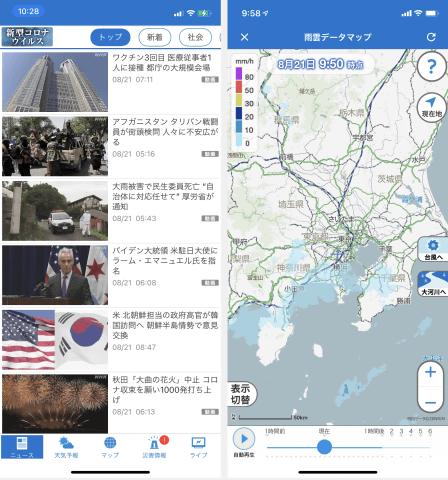
When you open the "NHK News / Disaster Prevention App", five menus "News", "Weather Forecast", "Map", "Disaster Information" and "Live" are displayed at the bottom of the screen. If you tap "Map" in this, "Rain cloud data map" that visualizes the situation of rain clouds nationwide will be displayed.
"News" top screen (left) and "Rain cloud data map" screen (right)The rain cloud data map is a visualization of the data of "High resolution nowcast" (1 hour before to 1 hour later) and "Short-term precipitation forecast (1 to 6 hours later)" announced by the Japan Meteorological Agency. It is easy to understand because it is displayed in different colors according to.
You can zoom in / out the map with the "+" and "-" buttons at the bottom right or pinch out / pinch in. Also, by moving the slide bar at the bottom of the screen, you can look back on the state of the rain clouds from 1 hour ago to the present, and you can also grasp the forecast of the arrangement of rain clouds from the present to 6 hours later.
To display "Hazard Map" or "Sediment Disaster Risk Map"
You can switch not only to the rain cloud data map but also to other disaster information.
Tap "Switch display" at the bottom left to display "flood information", "mesh weather (forecast)", "weather information / warning information", "earth and sand disaster risk map", "tornado warning information", and "river". Information Large rivers, river information small and medium-sized, earthquake information, tsunami information, hazard maps such as floods and sediment-related disasters are lined up.
Map switching screen (left) and "flood information" screen (right) "Mesh weather (forecast)" screen (left) and "weather information / warning sediment disaster warning information" screen (right) "earth and sand disaster risk map" screen (Left) and "Earthquake Information" screen (Right) "Hazard Map (Flood)" screen (Left) and "Hazard Map (Sediment Disaster)" screen (Right)To display "live camera" images and "water level information" of rivers
If you tap a river on the map after selecting "River Information", the line of the river will be highlighted thickly, and a camera icon indicating a live camera and a triangular icon indicating water level information will be displayed. Tap each to see water level information and live camera images.
"River information large river" screen. The river is highlighted (left). When you tap a river, the camera and water level information icons are displayed (right) Live camera screen (left) and water level information screen (right)To set the "push notification" function
In addition, you can register "Region" on the setting screen by tapping the setting button (gear icon) on the upper right of the main screen. Up to 3 area settings related to weather and disasters can be registered, and by registering an area here, disaster information for that area can be received by push notification.
In addition to weather warnings, push notifications regarding weather and disasters can receive sediment disaster warning information, record short-time heavy rain information, river information, evacuation information, heat stroke information, as well as tsunami information and earthquake information. Seismic information can be selected from four types: "seismic intensity 3 or higher", "seismic intensity 4 or higher", "seismic intensity 5 lower or higher", and "not notify".
Push notification setting screen (left) and regional setting screen (right)To check all the disaster information of "current position"
Also, in the "Disaster Information" corner at the bottom of the top screen, you can tap "Current Location" in the top menu to display a list of weather warnings, warnings, evacuation information, etc. at your current location. Furthermore, by selecting from the menus of "Tsunami", "Earthquake", "Typhoon", "Warning / Warning", "Sediment disaster", "Tornado", and "Heavy rain" in the upper menu, detailed information of each is displayed, and "Map" on the upper right. Tap "View" to move to the map screen.
Tap "Current location" to display a list of weather warnings and evacuation information (left). "Earthquake information" screen (right) "Typhoon information" screen (left) and "alarm / warning" screen (right)So far, we have explained how to use the "NHK News / Disaster Prevention App", focusing on the map function, but this app, which allows you to easily switch information from the bottom menu of the top page, is very easy to use (however, the operation method is easy to understand). Only the "Map" screen needs to tap the "x" in the upper left to switch to another menu). It can be said that it is a good app to install in advance.
If you like maps, you should read Yoshiaki Kataoka's recommended articles on maps and location information.
In INTERNET Watch, in addition to the long-lived serialization "Internet Map Watch of Hobbies" that started in October 2006, three special map serializations, "Map and Location Information" and "Map and Design", which are derivative series, are being posted. Mr. Yoshiaki Kataoka, a geowriter, talks about the latest services and products related to digital maps and location information, the latest trends in positioning technology, examples of utilization of location information technology, digital map diagrams and expressions, graphic design / UI design, etc. We will deliver it one by one.
Yoshiaki KataokaFreelance writer. He focuses on maps and location information in IT, and covers a wide range of map and location information related topics such as Internet map sites, positioning systems, navigation devices, corporate map solutions, paper maps, and open data. I'm chasing. He is a surveyor. Impress R & D has released books "IoT Business Created by Location Information Tracking", "This is Amazing! Map Making Site", and co-authored books "Location Information Big Data" and "Let's Create the Future with Ideathons and Hackathons".

![10th generation Core i5 equipped 9.5h drive mobile notebook is on sale at 50,000 yen level [Cool by Evo Book] 10th generation Core i5 equipped 9.5h drive mobile notebook is on sale at 50,000 yen level [Cool by Evo Book]](https://website-google-hk.oss-cn-hongkong.aliyuncs.com/drawing/article_results_9/2022/3/9/4a18d0792cae58836b71b9f591325261_0.jpeg)


![[Amazon time sale in progress! ] 64GB microSD card of 1,266 yen and wireless earphone with noise canceling function of 52% off, etc. [Amazon time sale in progress! ] 64GB microSD card of 1,266 yen and wireless earphone with noise canceling function of 52% off, etc.](https://website-google-hk.oss-cn-hongkong.aliyuncs.com/drawing/article_results_9/2022/3/9/c88341f90bab7fe3ce1dc78d8bd6b02d_0.jpeg)
